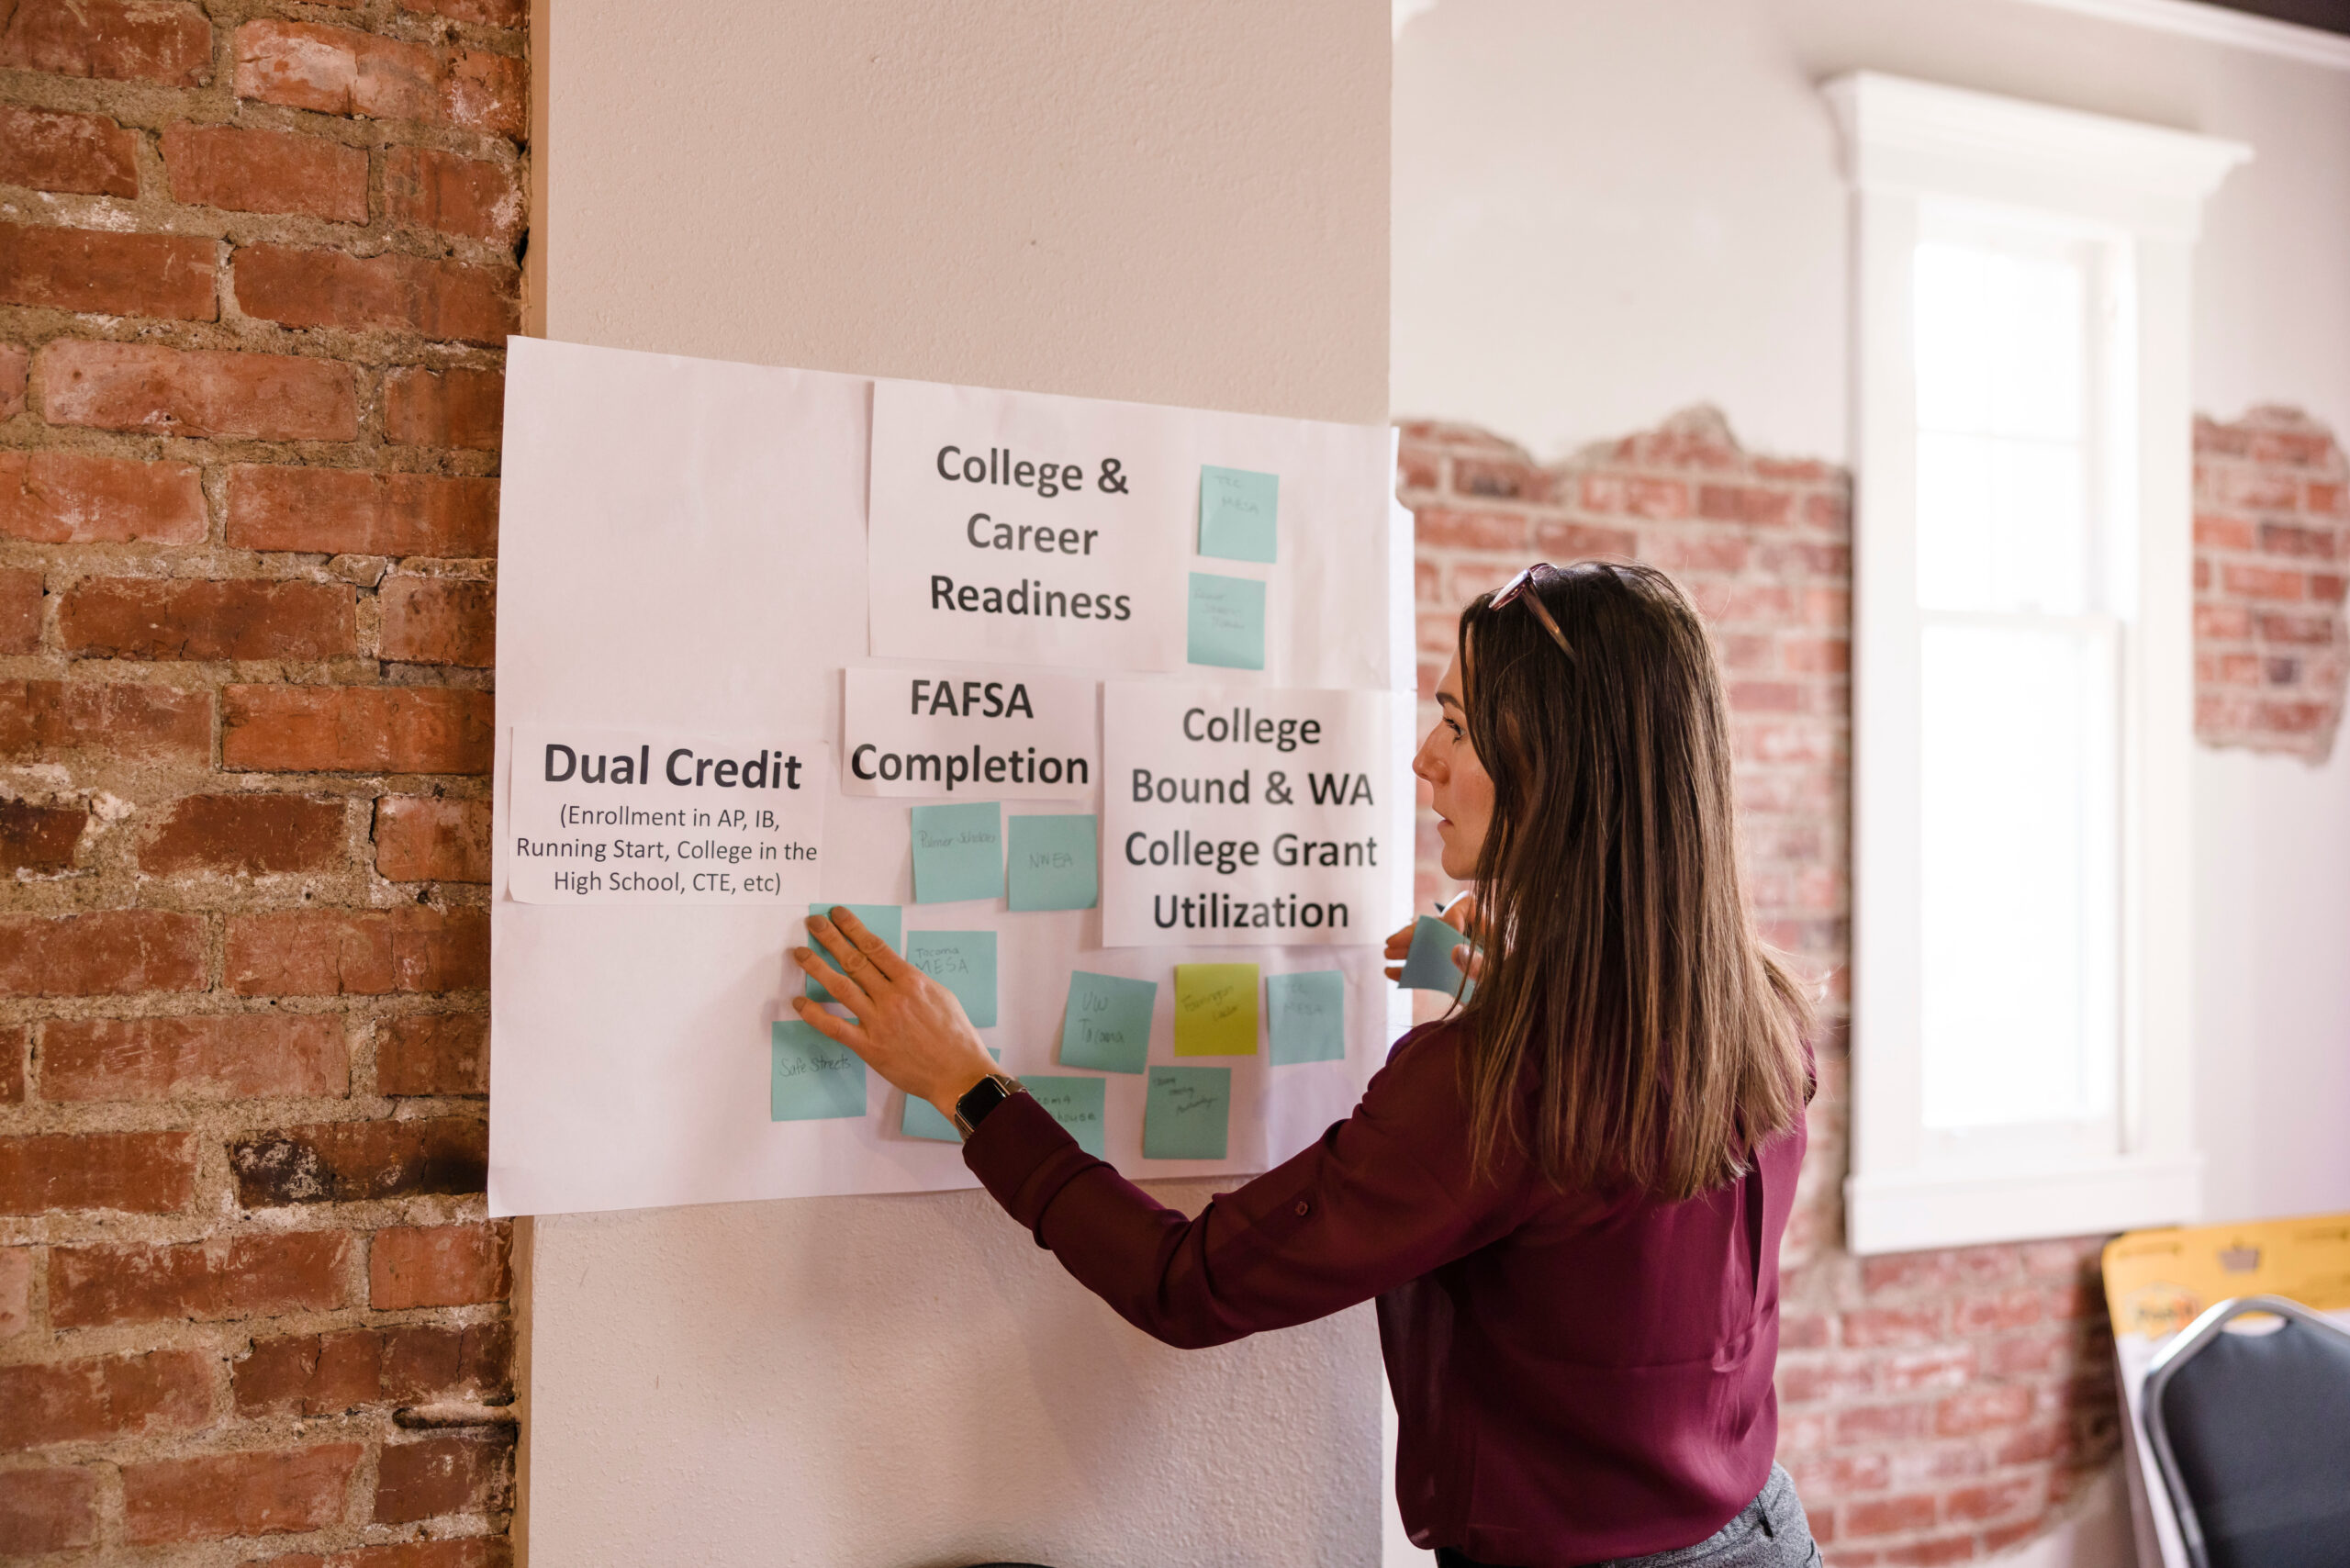
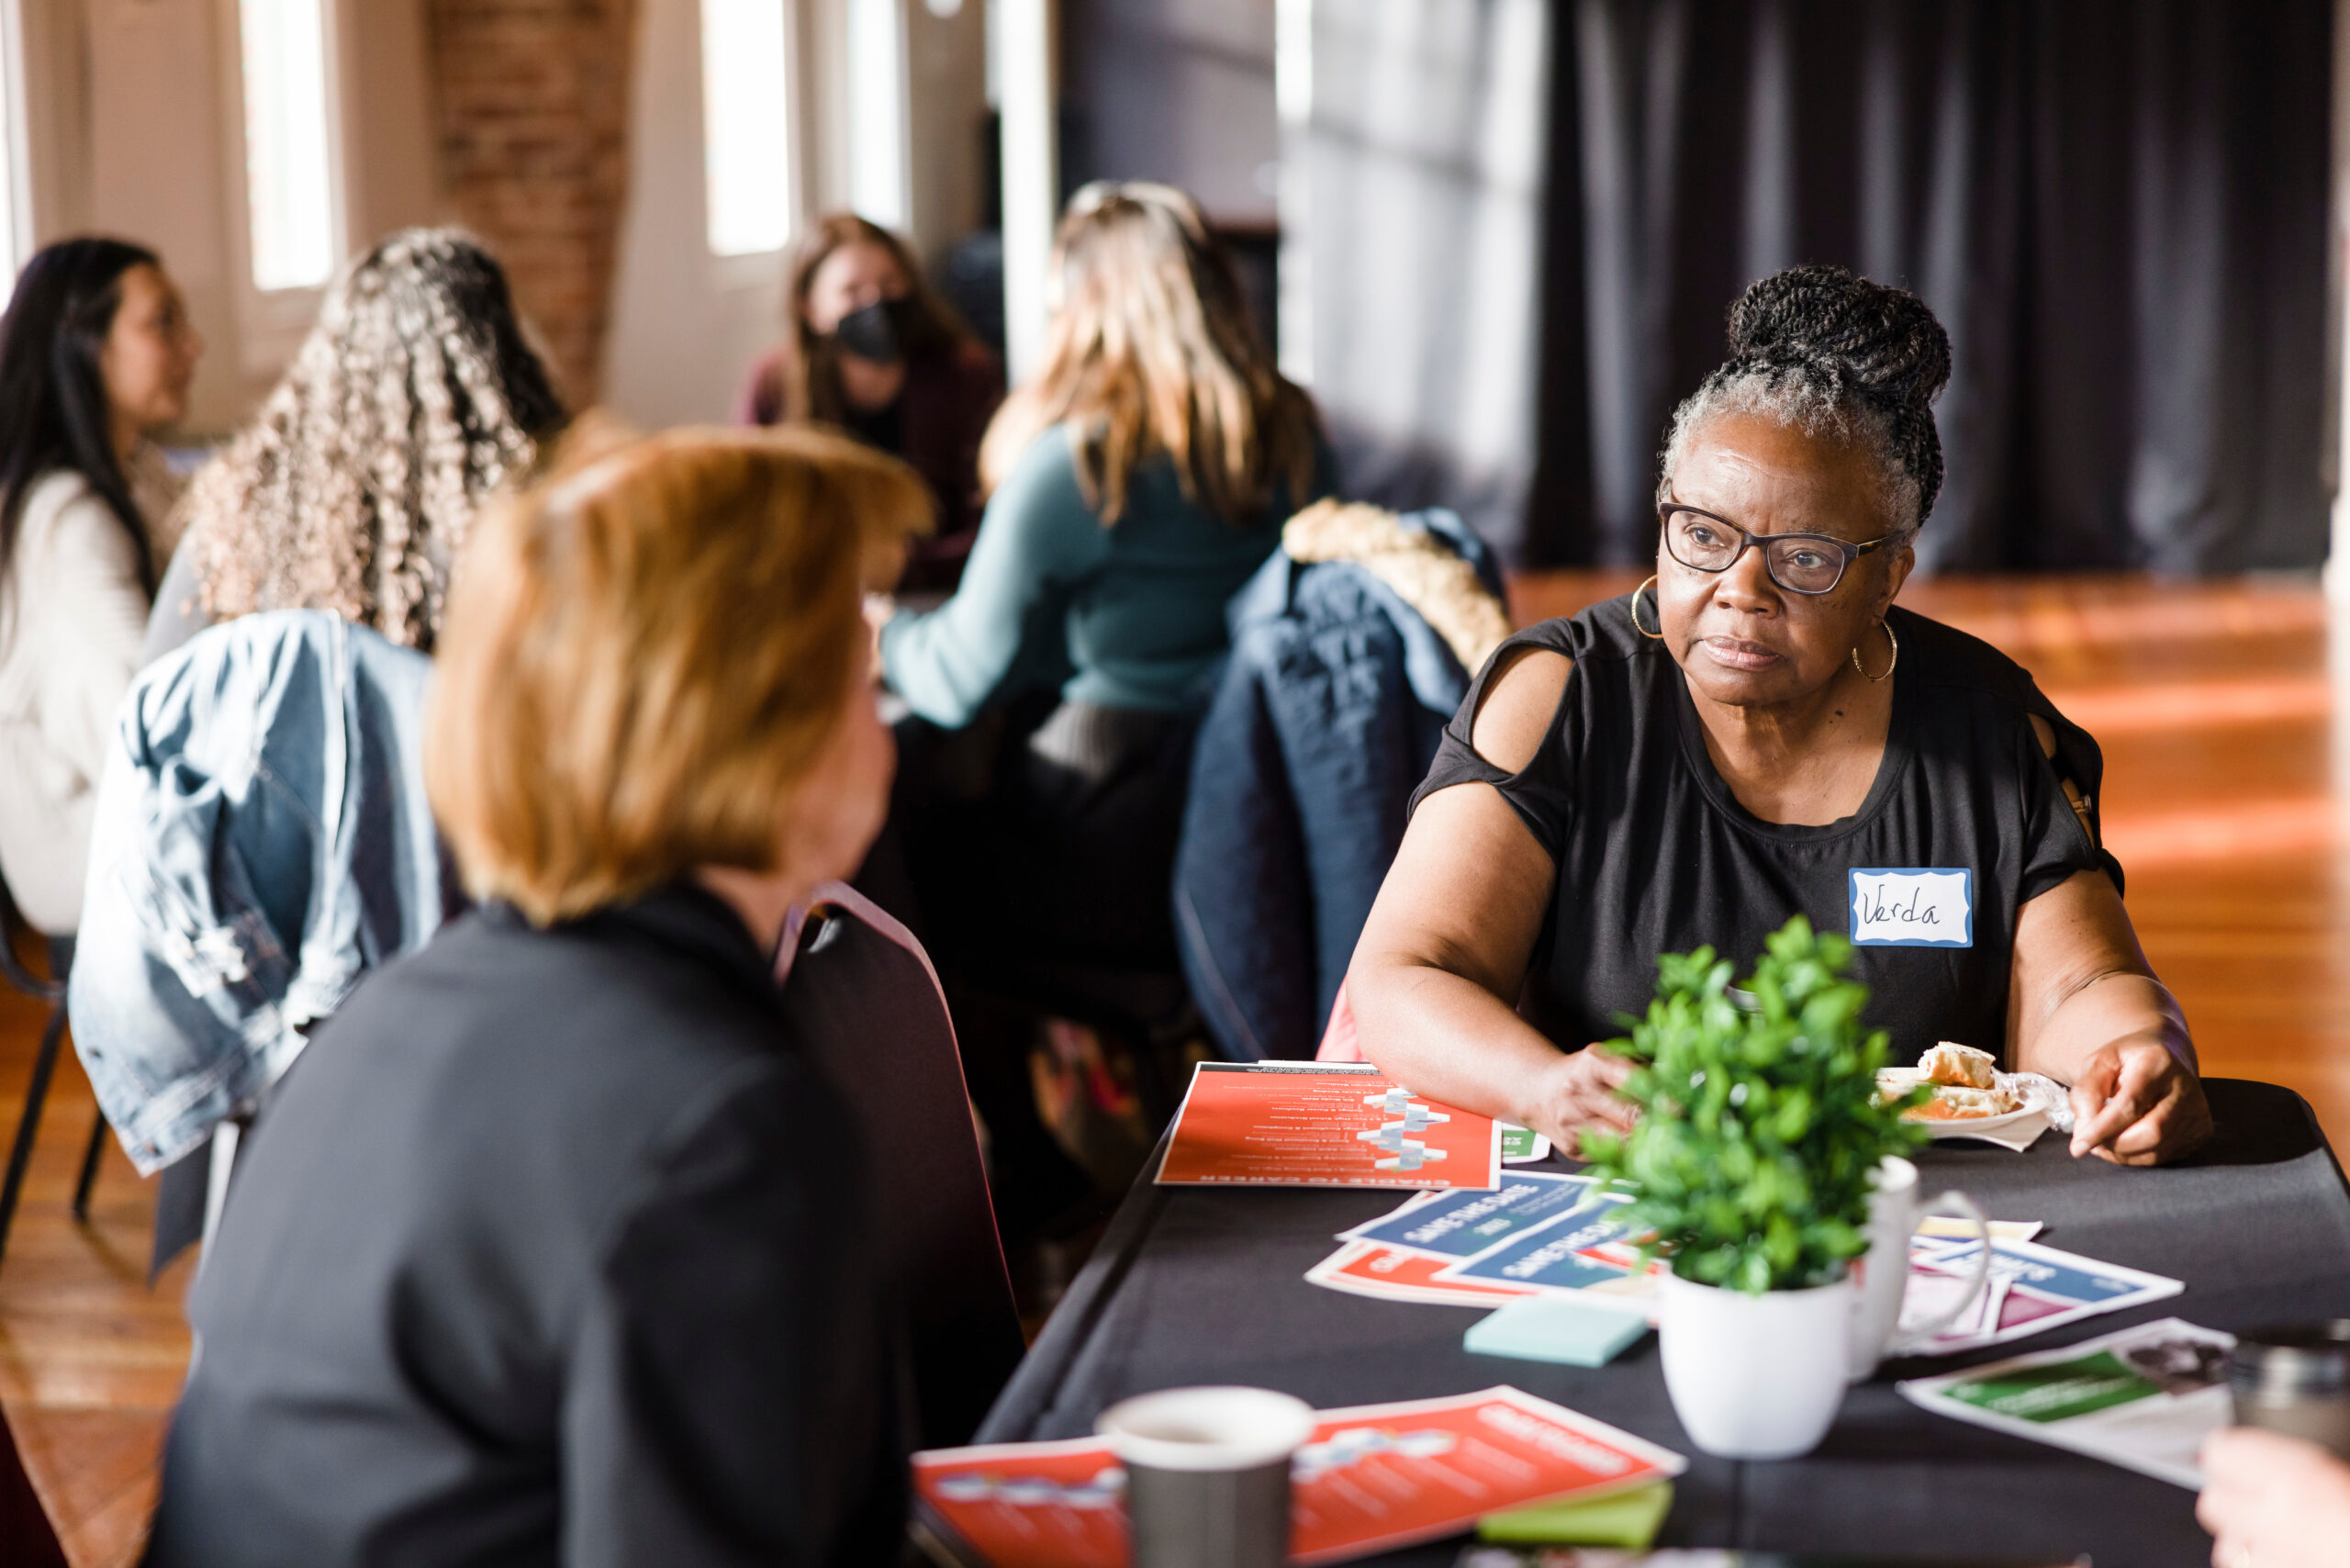
Explore how TPS enrollment and student demographics have changed over time.
Explore chronic absenteeism rates by location and overlapping identities.
Explore how and where summer learning programs are reaching students.
Explore current TPS preschool enrollment and child care capacity.
Explore how TPS compares in kindergarten readiness to other WA districts.
Explore how reading and language literacy rates across Tacoma have changed over time.
Explore the percentage of students meeting sixth grade achievement goals.
Explore the number of eighth grade students passing algebra or geometry.
Explore how TPS schools vary on composition and achievement regarding students passing classes.
Explore the number of students taking advanced classes eligible for college credit.
Explore how extended graduation rates vary within Tacoma between groups over time.
Explore the state of Tacoma's college entry exams and varied rates by location.
Explore data in students who enroll in a two-year or four-year institution.
Explore the percentage of TPS graduates who complete a certificate or degree within six years of graduation.
These dashboards track data for high school graduation, college enrollment, college completion, and over a dozen Cradle-to-Career and community indicators.
Our Collaborative Action Networks (CANs) use the dashboard to help inform strategic interventions. Increasingly, we are also using (unpublished) dashboards for ways to evaluate how interventions are working, and for Continuous Improvement. Many partners also use the dashboards to aid in grant reporting and fundraising.
Data is currently updated annually, between six to twelve months after TPS completes an academic year. We are moving to more frequent data release schedules, and to regularly updating certain key data points.
The dashboards measure current and historical rates for each indicator, along with gaps by race, poverty and program. Each indicator has several story points allowing different types of filtering and disaggregation.
The majority of our data (graduation, grades, attendance, etc.) comes from raw files through our data sharing agreement with Tacoma Public Schools. Standardized testing data comes from the state, and other data comes from a variety of state agency and nonprofit sources.
Different agencies and organizations use different metrics or criteria to calculate their results. Reporting requirements also change frequently due to state and federal legislation. We do our best to validate data and update based on requirements, but there may be discrepancies. See our data workflow for more information on our methods.
Please email data@graduatetacoma.org for more information.
By 2030, 70 percent of Tacoma Public Schools students will earn a degree, technical certificate, or gain a good-earning wage employment opportunity within six years of high school graduation. Targeted efforts will focus on students of color and those impacted by poverty.
Subscribe to our email newsletter today and be the first to hear about the latest news, announcements, and happenings in the community.
919 S 9th St
Tacoma, WA 98405
(253) 272-1600 | info@graduatetacoma.org